Quant Strategies
Systematic swing trading strategies built on backtested quantitative signals. Six distinct approaches spanning mean reversion, momentum breakout, chart pattern recognition, and focused mega-cap — each with full trade history transparency.

Transparent Strategies
Positioned offers a suite of quantitative strategies spanning mean reversion, momentum breakout, chart pattern recognition, and focused mega-cap approaches — each designed for a different risk profile and trading style.
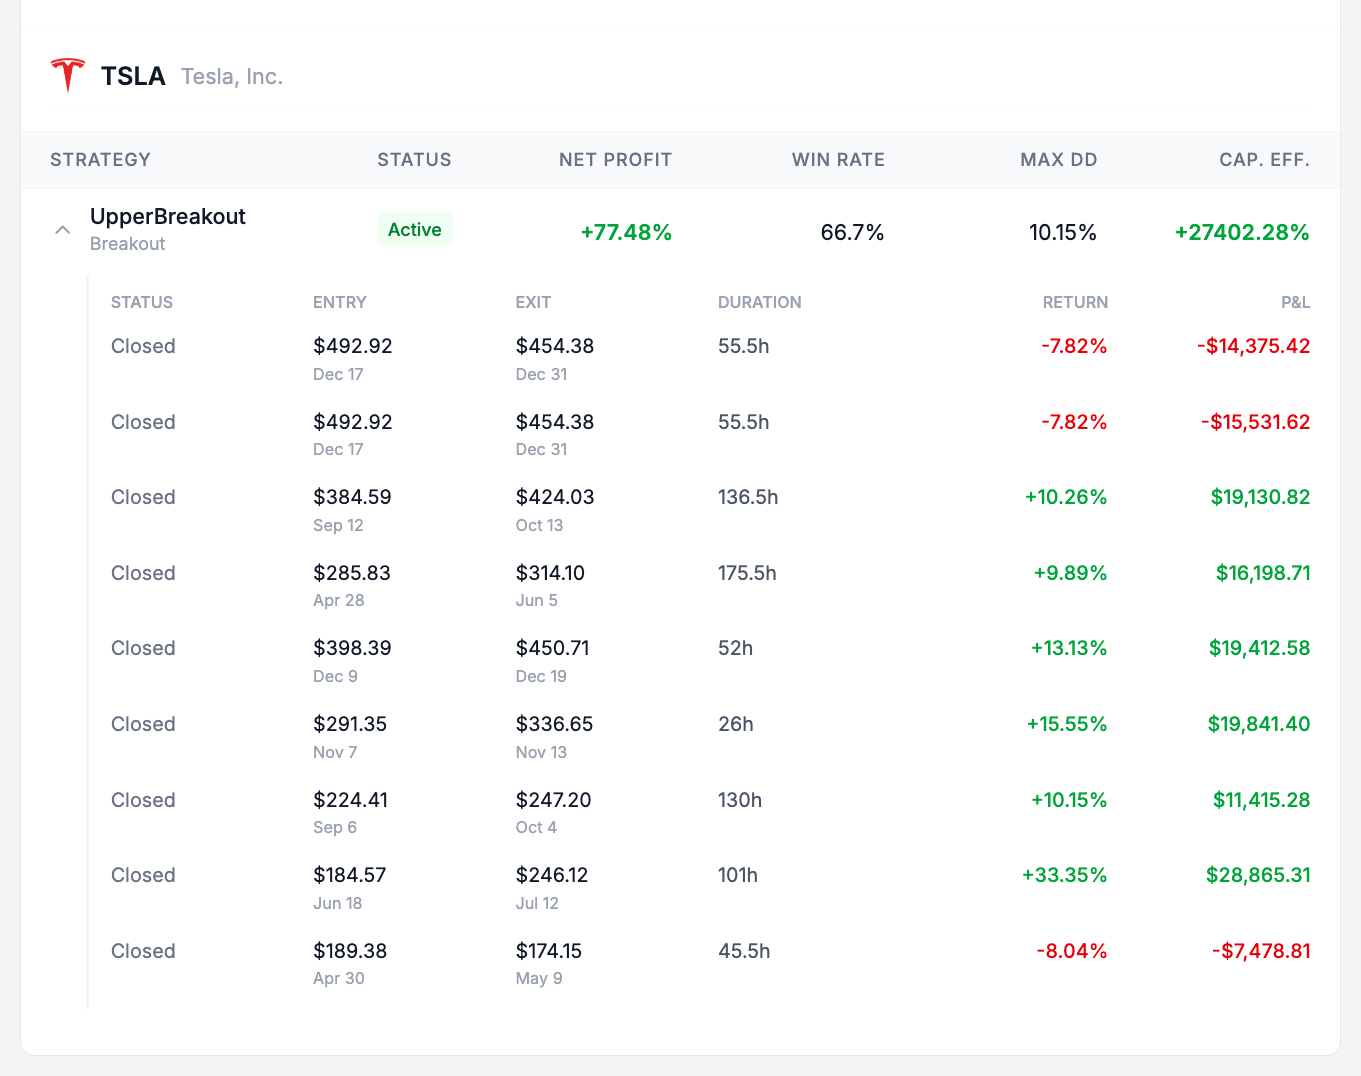
Every strategy publishes its complete trade history: entry and exit prices, hold duration, win rate, and return distribution. We don't issue signals behind a black box — you see every position, open and closed, across every stock and every strategy so you can evaluate performance on your own terms before committing capital.
Strategy Suite
Six distinct strategies across four categories, each backtested over four years of US equity data. Select the approach that fits your risk tolerance and trading horizon.
BB Mean Reversion
Buys when prices fall below their lower Bollinger Band with deeply oversold RSI, capturing short-term recoveries as price reverts to its statistical mean.
Mean Reversion
A highly selective strategy that enters only when a stock's Z-Score reaches an extreme dislocation confirmed by 8 independent filters, targeting consistent moderate gains with the highest win rate in the suite.
Keltner Channel Breakout
Enters when buying pressure pushes price above the upper Keltner Channel, using ATR-based volatility envelopes that avoid distortion during extreme moves. A two-phase adaptive trailing stop lets breakouts develop, then locks in gains.
BB Upper Breakout
Identifies stocks breaking above the upper Bollinger Band — a signal of abnormal buying pressure that often marks the start of a sustained directional move driven by institutional accumulation or earnings catalysts.
Chart Patterns
Trades five academically researched geometric patterns — ascending triangle, rectangle, double bottom, inverse head & shoulders, and cup with handle — using structurally derived price targets based on Thomas Bulkowski's research.
Magnificent Seven
A per-symbol optimized approach tailored to each of the seven mega-cap tech stocks. Each name receives its own strategy type, indicator parameters, and risk settings calibrated to its individual price dynamics.
How Our Strategies Work
Every strategy follows a systematic framework: technical indicators such as Bollinger Bands, Keltner Channels, Z-Scores, and chart patterns generate entry signals when specific statistical conditions are met. No discretionary judgment — the rules are defined, tested, and applied consistently.
Risk management is built into each strategy at the trade level. ATR-adaptive stops adjust to a stock's own volatility, trailing stops protect gains as positions develop, and catastrophic stop floors cap worst-case losses at a fixed percentage.
Most strategies apply a regime filter before entering a trade, screening for favorable trend, momentum, and volatility conditions. This reduces exposure during unfavorable market environments and concentrates capital in the highest-probability setups.
Exits are equally defined: mean reversion targets, trailing stop triggers, and time-based limits ensure positions close according to plan — not emotion. The full entry-to-exit lifecycle for every trade is published in the dashboard.
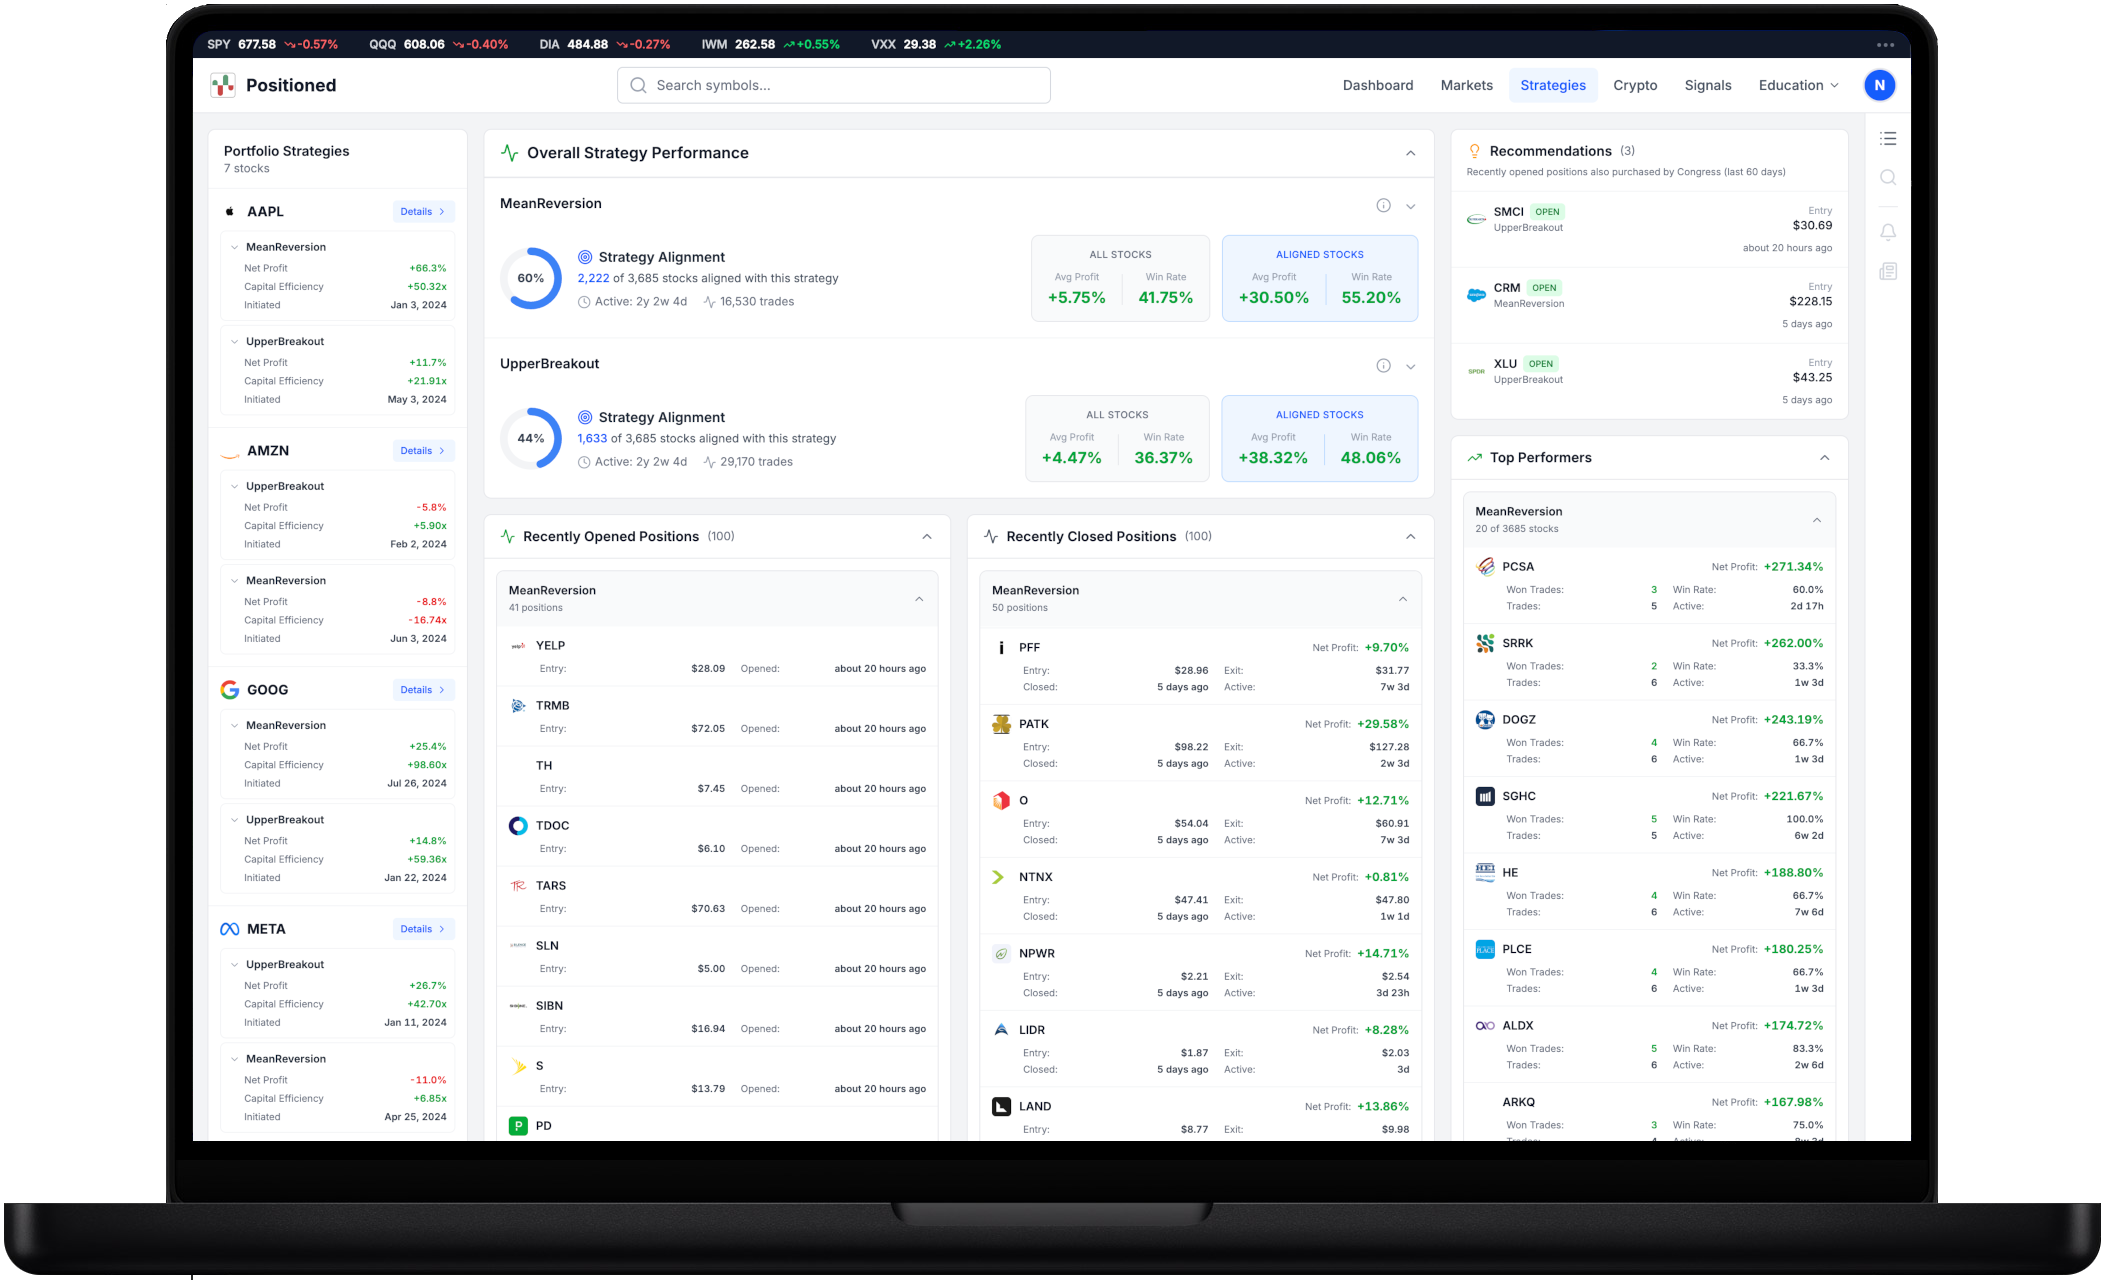
One Dashboard for Every Strategy
Monitor live performance, backtested results, and trading activity for all six strategies in a single view. Every metric you need to make an informed decision.
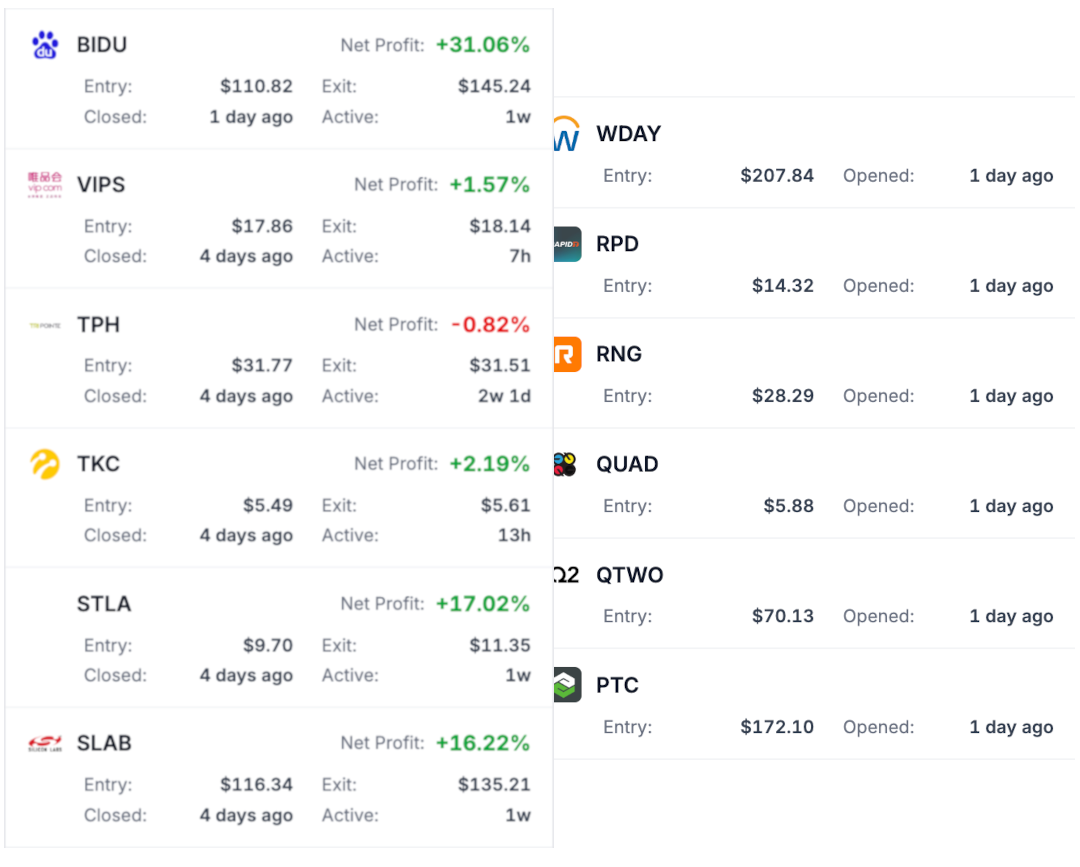
Track live strategy performance across all active positions. See which stocks are currently aligned with each strategy and monitor their progress.
Review comprehensive backtested results for each strategy. Analyze historical win rates, net profits, and capital efficiency metrics across thousands of symbols.
View strategy metrics for stocks in your portfolio. See how your holdings align with our quantitative signals and track their performance.
Discover strategy positions that align with recent congressional purchases. Find overlap between quantitative signals and smart money moves.
Identify the best-performing stocks for each strategy. See which symbols have delivered the highest net profits and win rates.
Discover stocks where quantitative strategy signals converge with institutional new positions and top buys — a three-way overlap that indicates high-confidence opportunities.
The Quantitative Edge
Distinct Strategies
Mean reversion, momentum breakout, chart pattern recognition, and focused mega-cap — four categories of quantitative strategy, each targeting different market conditions and risk profiles so you can diversify your approach.
Highest Win Rate
Our most selective strategy — Mean Reversion — uses an 8-layer entry filter that accepts only the highest-conviction setups, delivering a 71.5% win rate with an average max drawdown of just 3.19%.
Backtested History
Every strategy is backtested across four years of US equity data (2022–2025), spanning bull and bear markets. Complete trade histories — entry, exit, duration, and return — are published for independent verification.
Definitions & Methodology
1 Avg Net Profit (per stock): The mean return across all symbols that triggered at least one trade for a given strategy, calculated after simulated commission and slippage. Reflects expected per-stock performance, not per-trade.
2 Win Rate: The percentage of closed trades that exited at a profit. A sub-50% win rate can still be highly profitable when average winners significantly exceed average losers (positive payoff asymmetry).
3 Average Hold: The mean duration between entry and exit signals across all backtested trades. Shorter holds indicate higher capital velocity and more opportunities to redeploy capital.
4 Regime Filter: A pre-screening layer that evaluates trend, momentum, and volatility conditions before allowing a trade entry. Strategies with regime filters concentrate in favorable environments, reducing exposure during bear markets or choppy conditions.
Proven Performance
With 2025 officially in the books, our 24-month performance demonstrates the strength of our strategies. The results speak for themselves—and they're fully verifiable in our dashboard.
Our Mean Reversion strategy delivered an average net profit of 29.53% over an 8-week average hold, while our Breakout strategy achieved an average net profit of 36.66% in just 7 weeks.
We provide full visibility into win rates, trade duration, and capital efficiency so you can trade with the conviction of a proven, favorable risk-reward profile.