Institutional Analysis
The world's top hedge funds, super-investors, and asset managers must publicly disclose their equity holdings every quarter. Positioned transforms these 13F filings into actionable intelligence — so you can see exactly where professional capital is being deployed.

Institutional Disclosures
Every quarter, the world's most sophisticated investors — hedge funds, asset managers, and super-investors managing over $100 million — are legally required to disclose their equity holdings to the SEC via Form 13F.
Positioned transforms these mandatory filings into a decisive research advantage. We surface the high-conviction positions of legendary investors like Warren Buffett, Bill Ackman, and Michael Burry — alongside institutional giants like BlackRock, Tiger Global, and Renaissance Technologies.
Stop relying on outdated research. Start seeing exactly where the world's best investors are deploying their capital.
Follow the smart money.
Where Smart Money Is Flowing
Top stocks by net institutional capital inflow · Q3 2025
The Institutional Edge
Institutional investors account for approximately 85% of all U.S. equity trading volume. Their research budgets dwarf anything available to individual investors — yet their mandatory 13F disclosures give you a window into their highest-conviction ideas.
Positioned curates these filings into four distinct watchlist categories, each designed to surface a different type of institutional intelligence — from concentrated super-investor bets to broad market flow signals.
Super-Investors
Follow concentrated, high-conviction portfolios from legendary investors. Large position changes in these funds are meaningful signals of deep fundamental conviction.
Berkshire Hathaway, Pershing Square, Scion Asset Mgmt, Third Point
Large Hedge Funds
Detect sector rotation and institutional consensus among top research-driven managers with deep fundamental analysis teams.
Tiger Global, Viking Global, Lone Pine Capital, D1 Capital
Quant / Systematic
Monitor factor positioning and regime shift signals. Extreme positioning from quant funds can serve as a powerful contrarian indicator.
Renaissance Technologies, Two Sigma, AQR Capital, Citadel
Major Asset Managers
Track long-term capital allocation trends and index-driven flows from the firms that shape market liquidity and structure.
BlackRock, State Street, Fidelity, JPMorgan AM
Who Controls the Market
A handful of institutional giants control a staggering concentration of U.S. equity capital. Vanguard and BlackRock alone manage over $34 trillion in reported 13F holdings — more than the GDP of the United States and China combined.
When these firms adjust their portfolios, the ripple effects are felt across every sector and every stock. Tracking their quarterly position changes provides unmatched insight into the long-term direction of institutional capital flows.
Top Institutions by Assets Under Management
Reported 13F portfolio values · Q3 2025
Capital Flows: The Full Picture
Understanding where institutional capital is flowing requires seeing both sides of the equation. Tracking only what's being bought gives you half the story — knowing what's being sold reveals the other half.
When firms like BlackRock and Vanguard are aggressively accumulating a stock while simultaneously reducing positions in another, that rotation signal can be far more valuable than any single buy or sell in isolation.
Positioned surfaces both the largest accumulations and distributions each quarter, helping you identify the complete flow of institutional conviction.
Institutional Capital Flows
Net accumulation vs distribution · Q3 2025
The Scale of Institutional Intelligence
Positioned processes thousands of 13F filings every quarter, analyzing holdings data from the world's most influential investment firms. Every position change, every new buy, every liquidation — tracked, categorized, and surfaced for your research.
With over $65 trillion in assets under management across more than 6,000 institutional filers, our platform provides comprehensive visibility into how professional capital is being deployed across U.S. equities.
From concentrated super-investor bets to broad index flows, we help you understand the full spectrum of institutional positioning — so you can make more informed investment decisions.
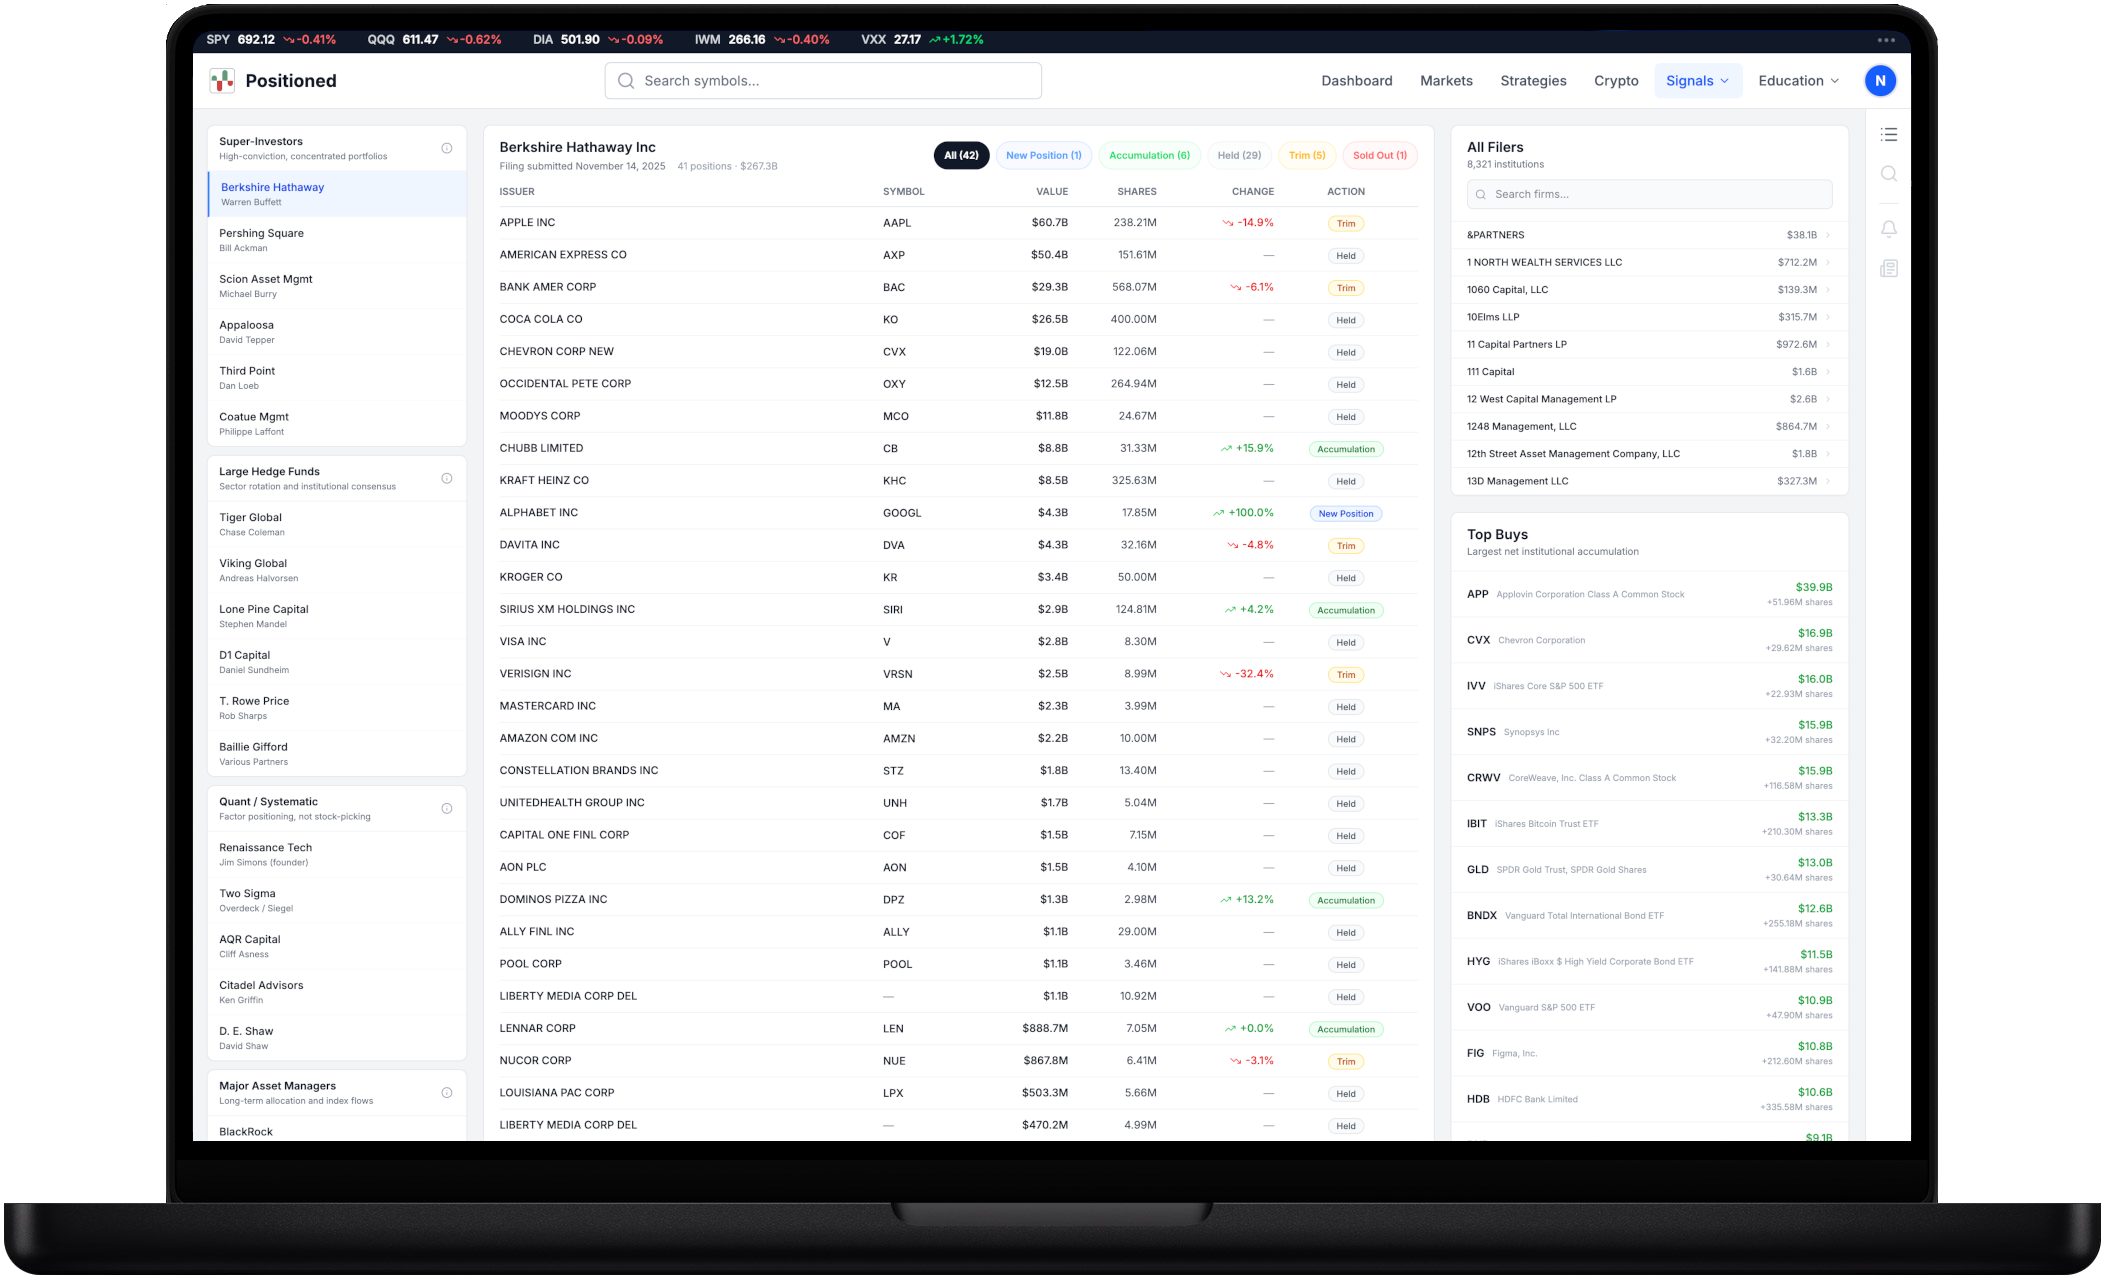
An Institutional Single Pane of Glass
Analyze 13F holdings from the world's top investors in one unified dashboard. Our platform aggregates quarterly disclosures, identifies consensus positions, and surfaces the capital flows that move markets.
Explore complete portfolio holdings for any institutional filer. Filter by action type — New Position, Accumulation, Held, Trim, or Sold Out — to instantly see how positions have changed quarter over quarter.
Discover stocks being added by the most institutional funds this quarter. When multiple sophisticated investors independently initiate the same position, it signals strong conviction worth investigating.
Track the largest net institutional accumulation across all filers. See which stocks are attracting the most new capital from hedge funds and asset managers — ranked by estimated dollar flow.
Monitor the largest net institutional distribution to identify stocks where professional capital is exiting. Distribution signals can be early warnings of fundamental deterioration or sector rotation.
Search and browse all 8,000+ institutional filers. Select any firm to instantly view their latest 13F holdings, position changes, filing dates, and total reported portfolio value.
Find stocks trading below their 13F filing-period low. When a stock is priced below what institutions reported, it represents a potential bargain backed by broad institutional conviction.
Why Institutional Data Matters
The SEC Disclosure Mandate
Since 1975, the SEC has required institutional investment managers with $100 million or more in qualifying assets to disclose their equity holdings quarterly — creating an unparalleled public window into professional capital allocation.
Institutional Dominance
Institutional investors account for roughly 85% of all U.S. equity trading volume. Their buying and selling decisions move markets — and 13F filings let you see exactly where that capital is flowing.
Research Analysts Per Firm
The largest institutional investors employ hundreds to thousands of research analysts, spending billions annually on fundamental and quantitative analysis. 13F filings distill that research into actionable position data.
Definitions & Sources
1 Disclosure Window: Under SEC Rule 13F, institutional investment managers must file Form 13F within 45 days after the end of each calendar quarter, disclosing their long equity positions valued at $100 million or more.
2 Assets Tracked: Approximate total assets under management across all 13F filers. Institutional investors collectively manage over $65 trillion in assets, representing the vast majority of professionally managed capital in U.S. equity markets.
3 Buffett Annual Return:Warren Buffett's Berkshire Hathaway has delivered a 19.8% compounded annual gain in per-share market value from 1965 to 2024, compared to 10.4% for the S&P 500 with dividends included (Berkshire Hathaway 2024 Annual Letter).
4 Historical Data: The SEC maintains comprehensive Form 13F data sets from July 2013 to present, providing over a decade of institutional holdings history for research and analysis.
5 S&P 500 Institutional Ownership: Institutional investors collectively own over 70% of S&P 500 companies by market capitalization, according to the Conference Board and Pensions & Investments annual survey of corporate ownership.