Track Congress
Congressional insiders consistently outperform the market. Track their trades, follow their conviction, and position yourself alongside some of the most informed. Stop guessing what they know — start seeing where they're putting their capital.

Congressional Analysis
Members of Congress often hold an unfair advantage — many have access to non-public insights that enable them to consistently outperform even the top hedge funds.
Positioned levels the playing field by distilling complex congressional disclosures into clear, actionable intelligence. We strip away the noise to show you exactly what Congress is buying, their bullish or bearish sentiment, and how their trades are performing in their portfolios.
Stop wondering what the insiders know and start using their moves to power your own investment strategy.
Stand on the shoulders of giants.
The Performance Gap
In 2024, congressional traders significantly outperformed the broader market. While the S&P 500 returned 23.3%, congressional Democrats averaged 31.1% and Republicans averaged 26.1%.
Top congressional leaders consistently outperform matched peers by 47 percentage points annually—a premium that reflects their unique position at the intersection of policy and markets.
The Intelligence Volume
Positioned processes an enormous volume of congressional trading data to surface actionable insights. Every disclosure, every trade, every pattern—analyzed and distilled into intelligence you can act on.
With over $706 million in trade volume and nearly 10,000 individual trades analyzed annually, we provide comprehensive coverage of congressional market activity.
Our tracking covers 113 active trading members across both chambers, giving you visibility into the full spectrum of congressional investment behavior.
A Congressional Single Pane of Glass
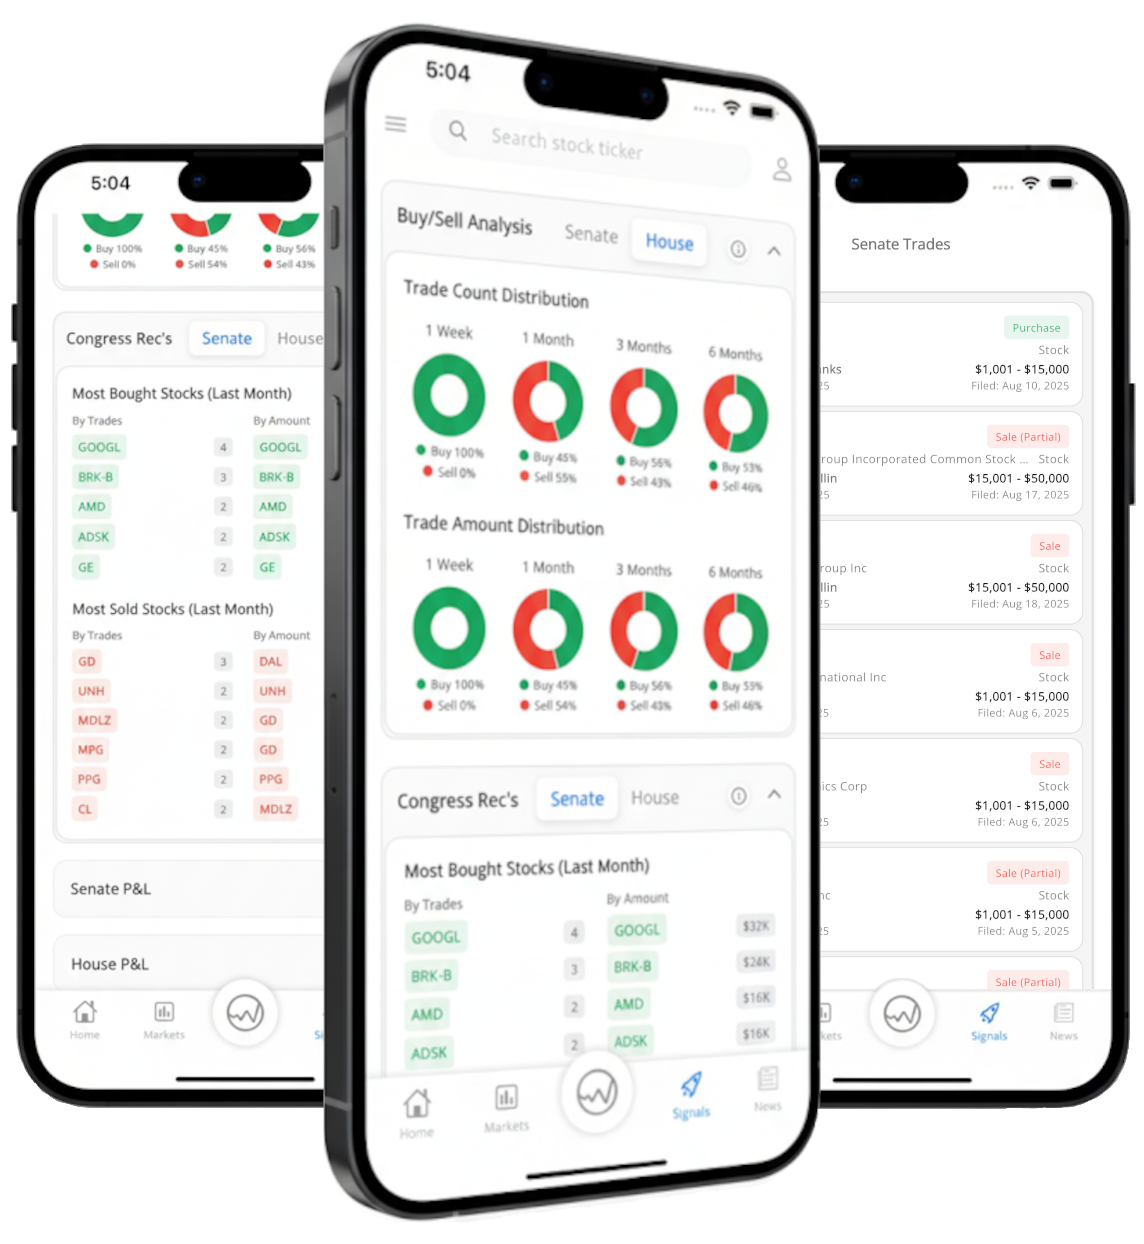
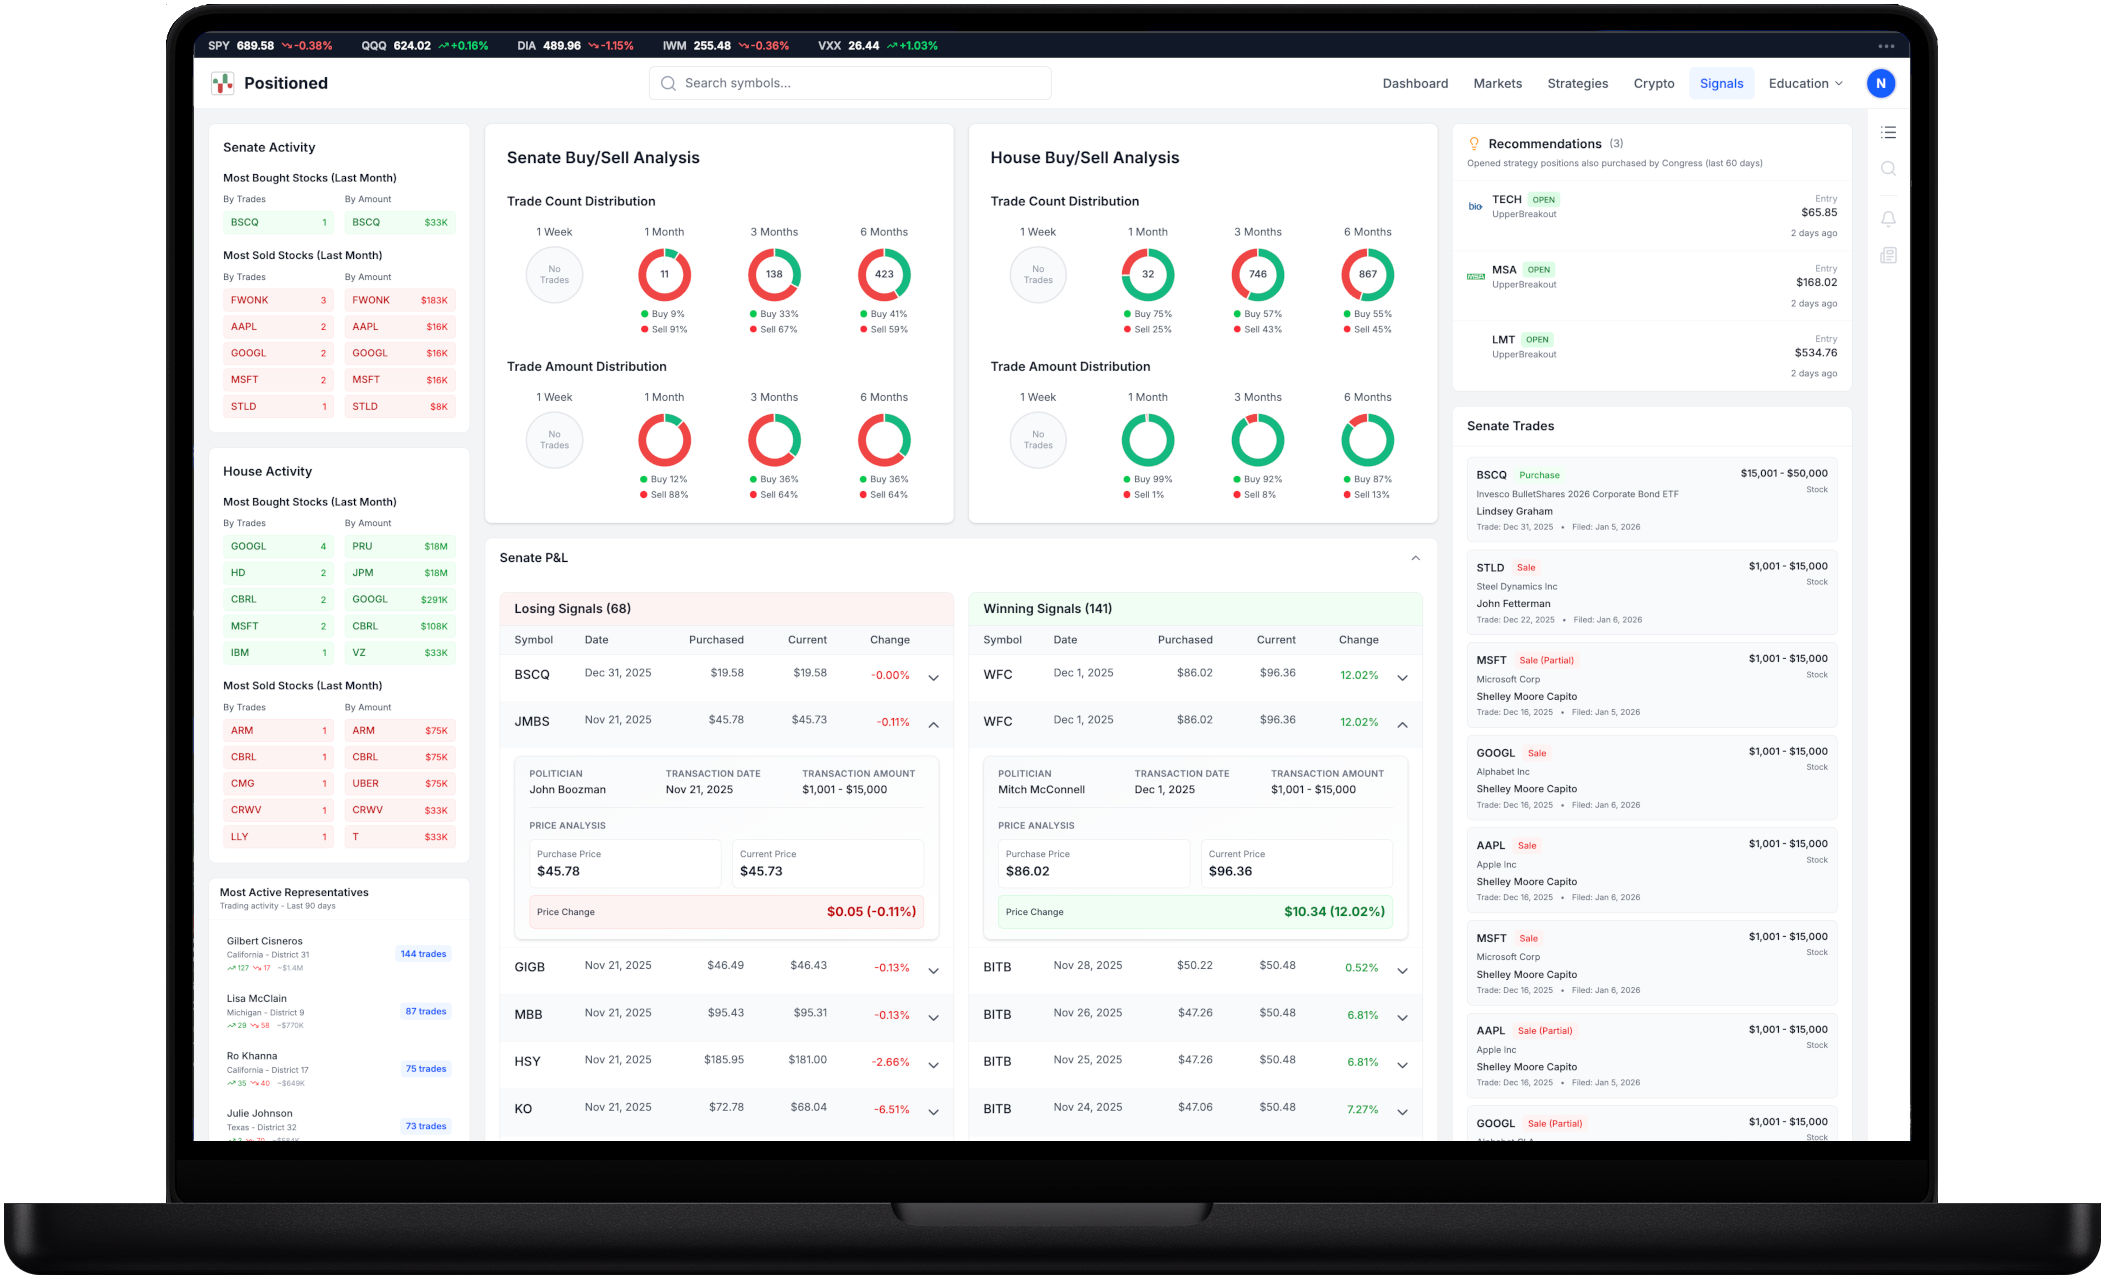
Monitor congressional trading activity as it happens. Our signals dashboard aggregates disclosures from both chambers, surfaces profitable patterns, and helps you act before the market catches on.
Track real-time buy and sell distributions across Senate and House chambers. Visualize trade count and dollar amount trends over 1 week, 1 month, 3 months, and 6 months.
Monitor profit and loss on every congressional trade. Compare purchase prices against current market values to identify winning and losing positions.
See which politicians are trading most actively and which stocks are being accumulated or distributed. Track the top movers in both chambers.
Discover strategy positions that align with recent congressional purchases. Find overlap between quantitative signals and smart money moves.
Identify the largest trades by estimated dollar value. See which members are making the biggest bets and on what stocks.
Access complete trade history for both Senate and House members. Filter by politician, symbol, date range, and transaction type.
The Insider Edge
STOCK Act Transparency
Since the STOCK Act became law, all members of Congress must disclose their trades—creating an unprecedented window into how America's lawmakers invest their personal wealth.
Committee Correlation
Members serving on key oversight committees show significantly higher returns in sectors they regulate, with finance committee members outperforming in financial stocks by up to 85%.
The Better Benchmark
Top congressional traders consistently outperform legendary investors like Warren Buffett by 2-3x annually, demonstrating the power of their unique information advantage.
Definitions & Sources
1 Alpha Window: The time period during which congressional trades demonstrate predictive value. Research indicates that following congressional trades within a 1-year window has historically generated excess returns compared to broad market indices.
2 Annual Alpha: The excess return generated above a benchmark (typically the S&P 500). A +47% leadership premium indicates that top congressional leaders outperform their matched peers by an average of 47 percentage points annually.
3 STOCK Act Disclosure Window: Under the Stop Trading on Congressional Knowledge (STOCK) Act of 2012, members of Congress must report stock transactions within 45 days of the trade date. This mandatory disclosure creates a window for public analysis of congressional trading activity.